


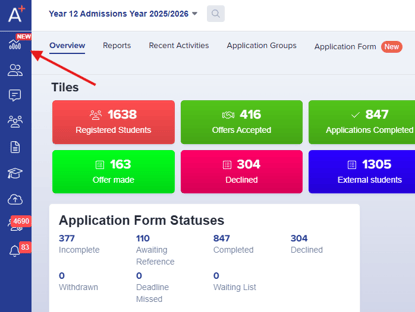
We’re excited to introduce Insights - a powerful dashboard built to help you understand, monitor, and optimise every stage of your admissions and marketing pipeline. Insights gives you real-time visibility of performance so you can make smarter, data-driven decisions throughout the year. You'll find Insights at the very top of the left-hand menu in Admissions+ - and you can start using it straight away!
Why you’ll love Insights
With Insights, you can:
-
Track how well your admissions and marketing pipeline is performing
-
Spot trends early in your cycle
-
Forecast numbers and compare year-on-year
-
Share clear, visual reports with colleagues and SLT
-
Understand which marketing activities drive the strongest results
-
Direct your budget where it has the most impact
How it works
Insights is organised into five key areas:
1. Summary
Your top-level dashboard, showing:
-
Enquiries, applications, offers accepted, and enrolments
-
Year-on-year comparisons
-
Marketing source performance
-
Monthly trend charts
You can customise the view, export PDFs, and import historic data for full comparisons.
2. Pipeline
A visual representation of applicants through each admissions stage. Customisable stages, inactivity alerts, conversion forecasting, health scores, and instant applicant search help you prioritise where action is needed.
In your pipeline you'll also be able to see applicant Health Scores. These show how engaged each applicant is, rated from Poor to Excellent. They’re calculated from positive actions (like logging in, completing applications, attending events) and negative ones (like inactivity or missed deadlines).
You can customise all indicators and point values, then recalculate scores with one click.
Health Scores help you quickly spot who needs attention and who’s most likely to convert.
3. Map view
See where your applicants live in relation to your school. Create circular or custom catchment areas, filter by distance or status, and update invalid addresses - all in one place.
4. Feeder schools
View which schools applicants are coming from and how well they convert. Great for identifying top feeder schools, new opportunities, and where to focus relationship-building.
5. Events
Track the impact and ROI of all recruitment events. View costs, attendee conversions, event effectiveness, and compare attendee vs non-attendee performance. Exclude non-recruitment events with one click.
Filters that work everywhere
Insights includes global filters at the top of every page, making it easy to focus on exactly the data you need. You can filter by:
-
Year or term of entry – great for comparing different intake cycles
-
Year group – zoom in on specific cohorts
-
Application status – see only enquiries, submitted applications, offers, etc.
-
Custom date ranges – analyse activity within any time window
When you use a date range, Insights automatically shows year-on-year comparisons, helping you see whether performance is improving or falling behind previous years.
Tips for getting started
📈 Configure your health score indicators
📍Set your school location on the Map View
📅 Enter costs for recent events to track ROI
✅Check your Summary dashboard to see your current pipeline
Once you've got these configured, your data will start rolling in! We hope you find these new tools helpful - and as ever please do let us know your feedback!
Need more help?
Check out the Knowledge Base (Data & IT Managers > Insights Area) for full instructions.
Comments